
What Is a Healthy Overhead Percentage for a Dental Practice in 2026?
Data Brief
- Published
- May 15, 2026
- Edition
- PPR-DB-2026-V4
- Publisher
- Private Practice Research
- Plain text mirror
- /healthy-overhead-percentage-2026.txt
Suggested citation
Private Practice Research. (2026). What Is a Healthy Overhead Percentage for a Dental Practice in 2026? (Report No. PPR-DB-2026-V4). Private Practice Research. https://privatepracticeresearch.org/reports/healthy-overhead-percentage-2026
Edition: PPR-DB-2026-V4 Status: DRAFT (pre-publish, awaiting operator review) Prepared by: Private Practice Research Editorial Staff. Data Desk. Published: 2026-05-15 Last Updated: 2026-05-01
PPR Methodology Callout This Data Brief synthesizes operating-cost benchmarks from ADA Health Policy Institute survey data, Dental Economics annual practice-economics surveys, and broker-published operating ratios to characterize healthy overhead percentages for U.S. dental practices in 2026. Overhead is defined as total operating expenses (staff compensation, occupancy, supplies, lab fees, equipment, marketing, administration) excluding the dentist-owner's compensation, expressed as a percentage of practice collections. Sub-categories are reported separately where source data permit. This article does not represent a valuation, does not constitute legal or tax advice, and is not affiliated with any DSO or transition broker. Authorship: Private Practice Research editorial staff.
Executive Summary#
A healthy overhead percentage for a U.S. general dentist solo practice in 2026 falls in the 60 to 65 percent range. Specialty practices (endodontics, oral surgery, orthodontics) trend lower at 55 to 60 percent. Pediatric and high-Medicaid-mix general practices trend higher at 65 to 72 percent.
Both source ranges come from ADA Health Policy Institute survey data and Dental Economics annual benchmarks. A single overhead percentage means almost nothing on its own without three pieces of context: what's included in the operating-expense line, what's excluded, and whether the percentage runs on collections or production. Brokers and lenders ask for all three before pricing a practice.
Overhead also drives valuation directly. A point of overhead is a point of EBITDA, and EBITDA times the buyer's multiple is the offer. Every broker, lender, and dental support organization (DSO) acquirer normalizes overhead before quoting a price. The full mechanics live in how dental practices are valued and the State of Private Practice 2026 Q2 Report.
Defining Overhead#
Overhead captures the recurring operating costs of running a dental practice. Included line items are staff wages plus payroll taxes and benefits, lab fees, dental supplies, occupancy, equipment and maintenance, marketing, administrative expenses and insurance, and professional services.
Three categories are excluded. Owner-dentist compensation, clinical and management, is reported separately. Depreciation and amortization tied to acquisition debt are excluded because they reflect the buyer's financing structure, not the practice's operating economics. One-time expenses are normalized out of the run-rate figure.
The formula is simple: total operating expenses divided by collections, times 100. The denominator is where most miscalculations start. Overhead runs on collections (cash actually received), not production (cash billed). The gap between the two typically runs 5 to 10 percent once insurance write-offs and aging adjustments settle. This brief uses collections throughout.
The 2026 Benchmark Ranges#
The following ranges reflect 2026 operating data from the cited sources:
- General dentist solo, urban-suburban: 60 to 65 percent [1][2]
- General dentist solo, rural or high-Medicaid mix: 65 to 72 percent [1]
- Specialty practices, endodontics and oral surgery: 55 to 60 percent [2]
- Orthodontic practices: 50 to 55 percent, reflecting a higher case-fee-to-overhead ratio [2]
- Pediatric practices: 65 to 70 percent, driven by a staffing-intensive operating model [2]
- DSO-affiliated practices: 55 to 62 percent post-platform overhead allocation [3]
- Multi-location group practices: 58 to 63 percent [3][4]
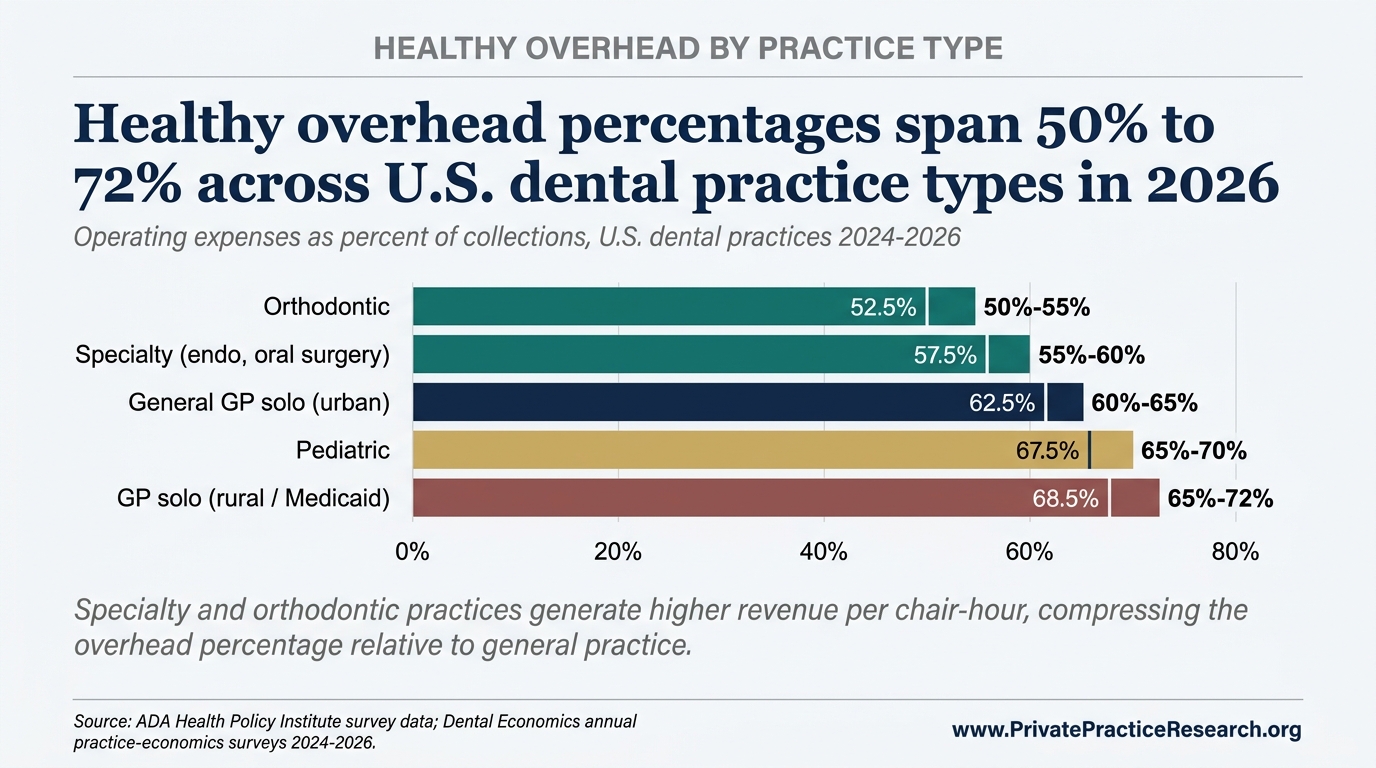
Read the figures above as central tendencies. Individual practices vary on case mix, payer mix, and local labor costs.
Why the Ranges Differ#
Three structural drivers explain most of the variance.
First, procedure mix and average case fee. An oral surgeon and a general dentist can carry similar fixed costs (lease, equipment, basic staff), but the surgeon's higher per-procedure fees produce a much larger collections base. Same expenses, larger denominator, lower percentage.
Second, staffing intensity. Pediatric and high-Medicaid practices need more clinical and administrative staff per chair. Since staff compensation already runs 25 to 30 percent of collections by itself, any structural increase in headcount lands directly on the overhead line.
Third, geographic cost of living. Metro practices pay more for rent and wages but typically charge more per procedure too, so the percentages roughly cancel. Geography moves valuation more than it moves overhead; the State of Private Practice 2026 Q2 Report section 5.2 walks through that effect.
What Pushes a Practice Above the Healthy Range?#
Three observed patterns recur across practices operating above their structural benchmark [2].
Staffing creep. A busy quarter prompts hiring; volume normalizes; headcount remains. Sustained over-staffing pushes the largest overhead category upward.
Lease and equipment commitments. Long-term commitments signed at peak production persist after production normalizes, anchoring fixed costs at unsustainable levels until lease terms reset.
Marketing dependency. Elevated new-patient acquisition spend can mask weak retention or case acceptance. The marketing line grows; the long-run collections base does not.
Why Overhead Matters for Valuation#
State of Private Practice 2026 Q2 Report section 3.1 documents the income approach to dental practice valuation: an EBITDA multiple applied to normalized earnings. Overhead is the largest single input to that calculation.
Take a $1.2 million practice running at 60 percent overhead. Push that to 65 percent and EBITDA drops $60,000. At the 5x multiple a solo GP typically clears, the sale price drops $300,000 with it. Run the math the other way: trim 5 points of overhead over the 18 months before listing, and the practice prices $300,000 higher. Few operating decisions move sale value that directly. The four-method valuation framework walks through how buyers normalize the number.
Sellers who walk in with clean, normalized overhead numbers tend to hold their multiple. Sellers who walk in with comingled owner compensation, unexplained spikes, or sloppy expense categories give the buyer's diligence team a list of reasons to lower the offer. The reductions come out of price, not goodwill.
Frequently Asked Questions#
Q1. What is a "good" overhead percentage for a solo GP in 2026? For an urban-suburban general dentist solo practice, 60 to 65 percent is the documented healthy band. Rural practices and those with a heavy Medicaid mix trend higher, at 65 to 72 percent, on lower fee schedules and heavier administrative load. Specialty practices run lower, generally 55 to 60 percent. The figure should be calculated on collections, exclude owner compensation, and be normalized for one-time expenses before any benchmark comparison.
Q2. Why do DSO-affiliated practices report lower overhead than independents? Platform-level expenses, including corporate administration, marketing, supply purchasing, and revenue cycle, are allocated at the dental support organization holding level rather than the individual practice. The practice-level figure reflects only direct operating costs, producing a structurally lower percentage that is not directly comparable to an independent's all-in figure.
Q3. Should overhead include the dentist-owner's salary? No. Owner compensation is reported separately. Seller's discretionary earnings (SDE) recasts the practice with owner compensation treated as profit available to a buyer. Overhead percentage is calculated before that recast. Mixing the two creates double-counting and is the most common normalization error in broker-prepared financials.
Q4. What is the largest overhead category? Staff compensation and benefits. In a healthy GP solo practice, total staff cost typically runs 25 to 30 percent of collections, making it the largest line item and the most sensitive to operational drift. Lab fees, occupancy, and supplies follow, each typically in the 5 to 10 percent range. Marketing varies most widely, from under 2 percent for retention-driven practices to over 8 percent for acquisition-dependent ones.
Q5. How quickly can an above-range practice return to the healthy range? Staffing and lease normalization typically takes 12 to 24 months, gated by attrition cycles and lease-renewal calendars. Marketing and supply normalization runs faster, generally 6 to 12 months. Equipment lease commitments are slowest, often locked through original term length. Buyers underwrite on trailing-twelve-months performance, so a turnaround initiated 24 months before listing shows up in the financials at sale. A turnaround initiated six months before listing does not.
Limitations#
The benchmark ranges above are drawn from self-reported survey data. Practices that participate in ADA HPI and Dental Economics surveys tend to run cleaner books than the median U.S. practice, which means the published ranges likely understate true overhead at the bottom of the distribution by 2 to 4 percentage points.
Source surveys also disagree on what counts as overhead. ADA HPI's operating-cost line excludes owner compensation; some Dental Economics tabulations include it, then back it out in a footnote; broker-prepared statements vary by firm. Comparing a 62 percent ADA HPI figure to a 68 percent broker statement is not an apples-to-apples comparison until both are recast on the same definition. The figures in this brief use the ADA HPI convention (owner compensation excluded, collections as denominator).
The 2026 ranges also reflect a market still adjusting to post-2020 wage inflation. Staff compensation rose 12 to 18 percent across U.S. dental practices between 2020 and 2024 per ADA HPI tracking, and the operating-cost stabilization measured here assumes that pace does not resume. Pre-2020 benchmarks should not be combined directly with 2024 to 2026 figures without that wage-base adjustment.
What This Means For Your Practice
The healthy overhead bands in this brief describe practice categories, not specific practices. Where a particular practice falls within or outside its category band is decided by practice-specific variables aggregate research cannot resolve: payer mix and write-down rate, lease terms and equipment financing schedule, hygiene-to-doctor production ratio, staffing intensity, and specialty service mix. The category band is a starting reference, not a target a defensible valuation can be set against without resolving these variables.
Sources#
[1] ADA Health Policy Institute, "Survey of Dental Practice" series and economic indicators, 2024 to 2025. [2] Dental Economics, annual practice-economics survey and operating-ratio benchmarks, 2024 to 2026. [3] FOCUS Investment Banking, "2026 Dental Industry Update," 2026, DSO platform operating ratios. [4] TUSK Practice Sales, "Q2 2026 Dental Market Report," 2026. [5] Private Practice Research, "The State of Dental Practice Values: 2026 Baseline Report."
Frequently Asked Questions
What is a healthy overhead percentage for a dental practice in 2026?
General dentist solo practices target 60 to 65 percent in urban and suburban markets and 65 to 72 percent in rural and high-Medicaid markets. Specialty practices run 55 to 60 percent. Orthodontic practices run 50 to 55 percent. Pediatric practices run 65 to 70 percent. DSO-affiliated practices run 55 to 62 percent on the affiliated-practice side after platform allocation. The bands synthesize ADA Health Policy Institute, Dental Economics annual practice-economics surveys, FOCUS Investment Banking, and TUSK Practice Sales data.
Why does overhead percentage vary by practice type and geography?
Three structural factors. Specialty practices have higher per-procedure billing and lower equipment-to-revenue ratios than general practice, which compresses overhead. Rural and high-Medicaid markets carry higher payer write-down rates, which raises the overhead percentage on the same operating cost base. DSO-affiliated practices show lower local overhead because some functions (marketing, billing, IT) are absorbed at the platform level rather than booked at the practice.
How does overhead percentage affect dental practice valuation?
Overhead percentage is a direct input to defensible valuation. Buyers normalize the practice's reported overhead against the band for its category and geography, then apply the multiple to the resulting EBITDA or SDE. A practice whose overhead sits above its category band typically faces a multiple compression unless the deviation is explained by transient costs (recent equipment purchase, one-time staffing event) that a buyer can underwrite as removable.