
The State of Dental Practice Values: 2026 Baseline Report
Inaugural Edition
- Published
- April 26, 2026
- Edition
- PPR-BASELINE-2026-V1
- Publisher
- Private Practice Research
- Plain text mirror
- /baseline-2026.txt
Suggested citation
Private Practice Research. (2026). The State of Dental Practice Values: 2026 Baseline Report (Report No. PPR-BASELINE-2026-V1). Private Practice Research. https://doi.org/10.5281/zenodo.19924758
robots: noindex, nofollow archived: true archive_date: 2026-05-04 archive_reason: Naming-fit migration. Publication renamed to State of Private Practice 2026 Q2 Report. URL preserved for citation continuity.#
The State of Dental Practice Values: 2026 Baseline Report#
Published by Private Practice Research Inaugural Edition · Volume 1 · April 2026
Edition ID: PPR-BASELINE-2026-V1 DOI: 10.5281/zenodo.19924758 Publication date: April 26, 2026 Last Updated: April 30, 2026 Prepared by: Private Practice Research Team Independent research disclosure: This report was produced without sponsorship, advertiser influence, or paid placement. No source profiled in this report compensated Private Practice Research for inclusion. Methodology and data limitations are disclosed in Section 8. Suggested citation: Private Practice Research. (2026). The State of Dental Practice Values: 2026 Baseline Report (Report No. PPR-BASELINE-2026-V1). Private Practice Research. https://doi.org/10.5281/zenodo.19924758 Contact: press@privatepracticeresearch.org
Executive Summary#
At a glance: General dental practices trade at 65 to 85 percent of annual collections. DSO acquisitions price at 6 to 12 times EBITDA. The dentist-owner share has dropped from 84.7 percent in 2005 to 72.5 percent in 2023. Retirement age has risen to 68.7 years. The 164 billion dollar U.S. dental market is projected to reach 270 billion dollars by 2034.
Dental practice valuation in the United States is at a structural inflection point. This report synthesizes data from ADA HPI, FOCUS Investment Banking, TUSK Practice Sales, and real-time monitoring of 100+ online dental industry sources - podcasts, broker webinars, CE-course recordings, transition-firm white papers, and trade publications - to establish 2026 baseline benchmarks across the four interlocking dimensions of practice value: ownership trends, the retirement wave, DSO consolidation, and the operational factors that separate premium from discounted transitions.
Key findings:
-
The retirement wave is real but slower than expected. The average dentist retirement age has risen to 68.7 years (up from 64.7 in 2001), extending career spans to 41.3 years on average. Still, more than 35% of active dentists are 55 or older, representing tens of thousands of practices that will transition within the next decade.
-
Practice values are stable to rising, but the spread is widening. General practices trade at 65-85% of annual collections in private transactions. DSO acquisitions command 6-12x EBITDA depending on scale. The gap between the best and middle-tier offers on any given practice has never been wider.
-
Ownership is declining but not disappearing. The dentist-owner rate dropped from 84.7% in 2005 to 72.5% in 2023. Younger dentists still become owners, just later, with 32% of 2011-2015 graduates owning practices 3-7 years post-graduation.
-
DSOs now affiliate with 16-17% of practicing dentists. The DSO market is projected to grow at 18% annually, reaching $200 billion by 2034. 69% of DSOs report their PE sponsors expect moderate-to-high increases in 2026 acquisition activity.
-
A $164 billion market with a $270 billion trajectory. The overall U.S. dental market reached $164 billion in 2024 and is projected to grow to $270 billion by 2034 at a 4.5% CAGR.
-
Industry leaders agree: preparation is the new differentiator. Across the institute's real-time monitoring of 100+ online dental industry sources surveyed for this report, the recurring consensus is that the gap between prepared and unprepared sellers has never been wider. Associate-driven production, digital workflows, growth trajectory, and staffing stability are what separate premium from discounted valuations.
1. Market Overview: The U.S. Dental Practice Landscape#
Dental practice in the United States spans approximately 200,000 offices generating $164 billion in annual revenue as of 2024, projected to reach $270 billion by 2034 at a 4.5% CAGR, with dentist-owner share declining from 84.7% in 2005 to 72.5% in 2023, solo practitioners representing 34% of the market, and 17% of dentists affiliated with PE-backed DSOs.
1.1 Market Size and Practice Count#
The United States has approximately 200,000 dental offices generating $164 billion in annual revenue as of 2024. The market is projected to reach $270 billion by 2034, driven by population growth, aging demographics requiring more complex care, and expanding insurance coverage.
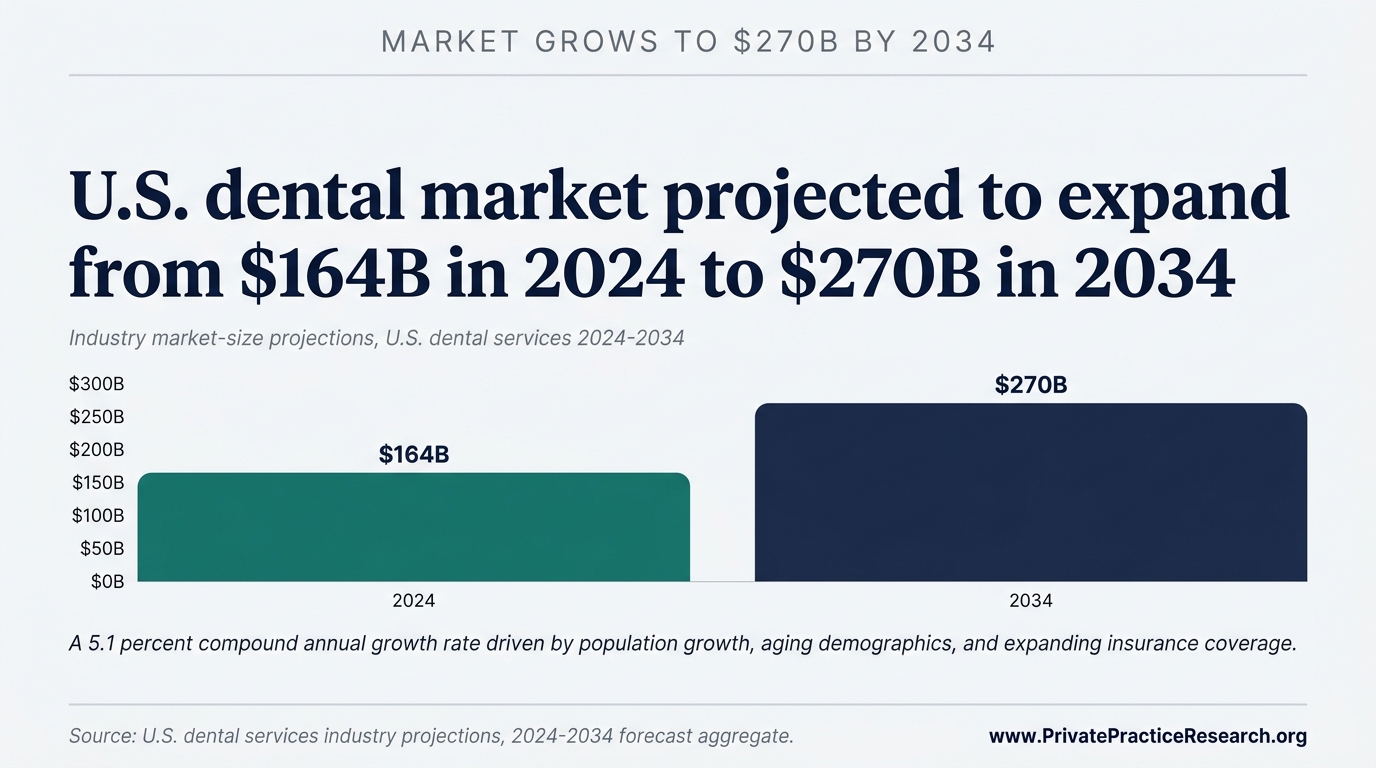
Sources: ADA Health Policy Institute, "Supply of Dentists" series; TUSK Practice Sales, 2025 Market Review & 2026 Outlook
1.2 Ownership Structure#
The practice ownership landscape has shifted materially over two decades:
| Year | Dentist-Owner Rate | Source |
|---|---|---|
| 2005 | 84.7% | ADA HPI, 2025 Report |
| 2015 | ~78% | ADA HPI |
| 2023 | 72.5% | ADA HPI, 2025 Report |
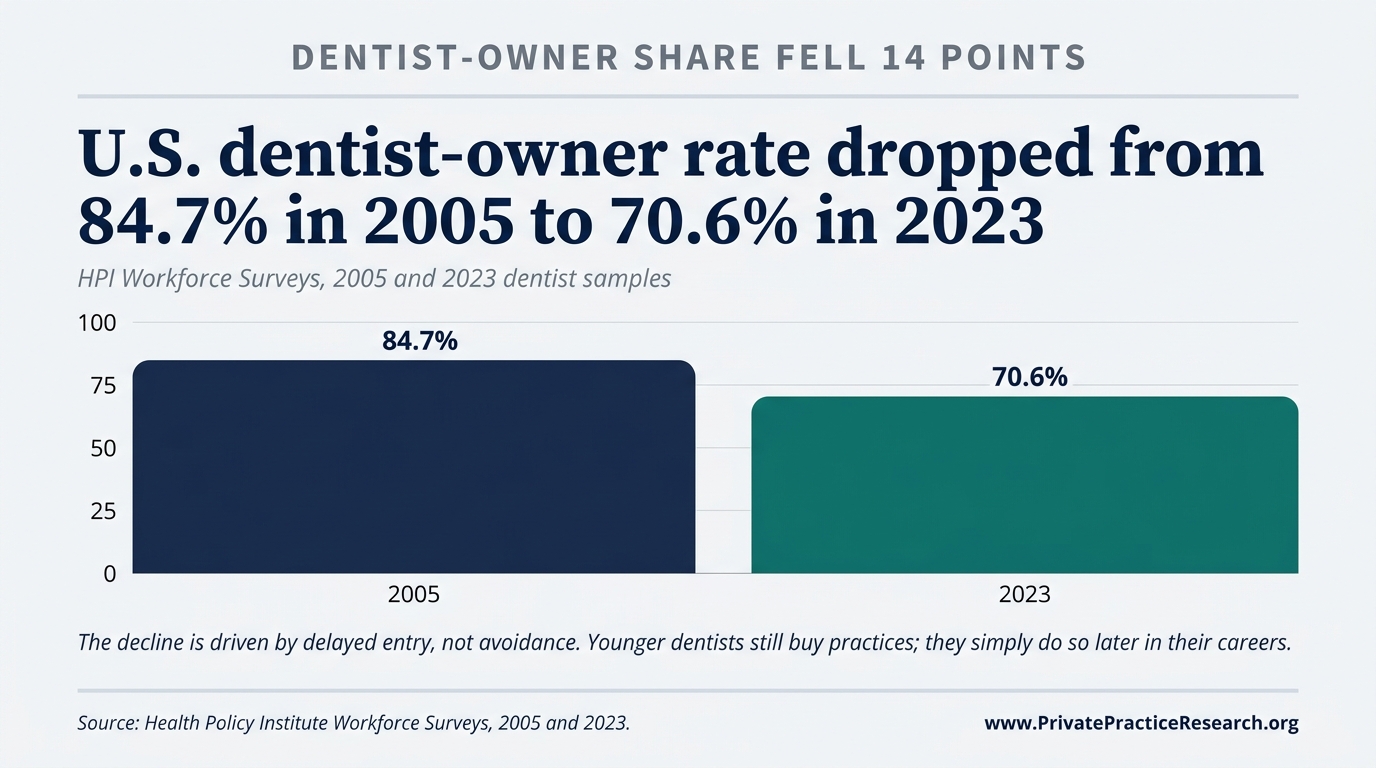 | ||
| Figure 1. Dentist-owner share of U.S. practicing dentists, 2005–2023. Sources: ADA HPI 2025 Report. |
Solo practitioners now represent 34% of the market, with 67% of dentists working in group settings and 17% affiliated with PE-backed DSOs. The remaining share includes multi-site independent groups and academic/government positions.
The decline in ownership is driven primarily by delayed entry, not permanent avoidance. ADA HPI data from June 2025 confirmed that younger dentists still become practice owners; they simply do so later in their careers. Among 2016-2020 dental school graduates, 21% owned practices within 3-7 years of graduation. Among 2011-2015 graduates, that figure reached 33%.
Sources: ADA Health Policy Institute, "Practice Ownership Trends" (2025); ADA News, June 2025
1.3 Workforce Demographics#
The dentist workforce is becoming younger, more female, and more diverse:
- Female dentists became the majority of dental school graduates for the first time in 2024, now representing approximately 40% of the active workforce. The ADA projects women will reach 50% of the practicing workforce by approximately 2040.
- Dentists under 35 who are practice owners have dropped from 25% to under 10% over the past two decades. Dentists aged 30-34 who are owners fell from 50% to 32% in the same period.
- Average GP net income was $207,980 in 2024, down from approximately $250,000 in 2010 (nominal dollars), while administrative workload has doubled over the same period.
Sources: ADA HPI, U.S. Dentist Workforce 2025 Update; TUSK Practice Sales, 2025 Market Review
2. The Retirement Wave: Quantifying the "Silver Tsunami"#
The active dentist workforce is aging rapidly, with over 35% of practitioners aged 55 or older, average retirement age rising from 64.7 years in 2001 to 68.7 years in 2024, and average career spans extending to 41.3 years, compressing annual practice supply while accumulating deferred-maintenance risk in practices held into the late 60s and 70s.
2.1 Age Distribution#
More than 35% of active U.S. dentists are aged 55 or older, with some states exceeding 40% in this cohort. This represents the largest concentration of near-retirement practitioners in the profession's history.
2.2 Retirement Timing Is Shifting Later#
The average dentist retirement age has risen steadily:
| Year | Average Retirement Age | Average Career Span |
|---|---|---|
| 2001 | 64.7 years | 37.8 years |
| 2024 | 68.7 years | 41.3 years |
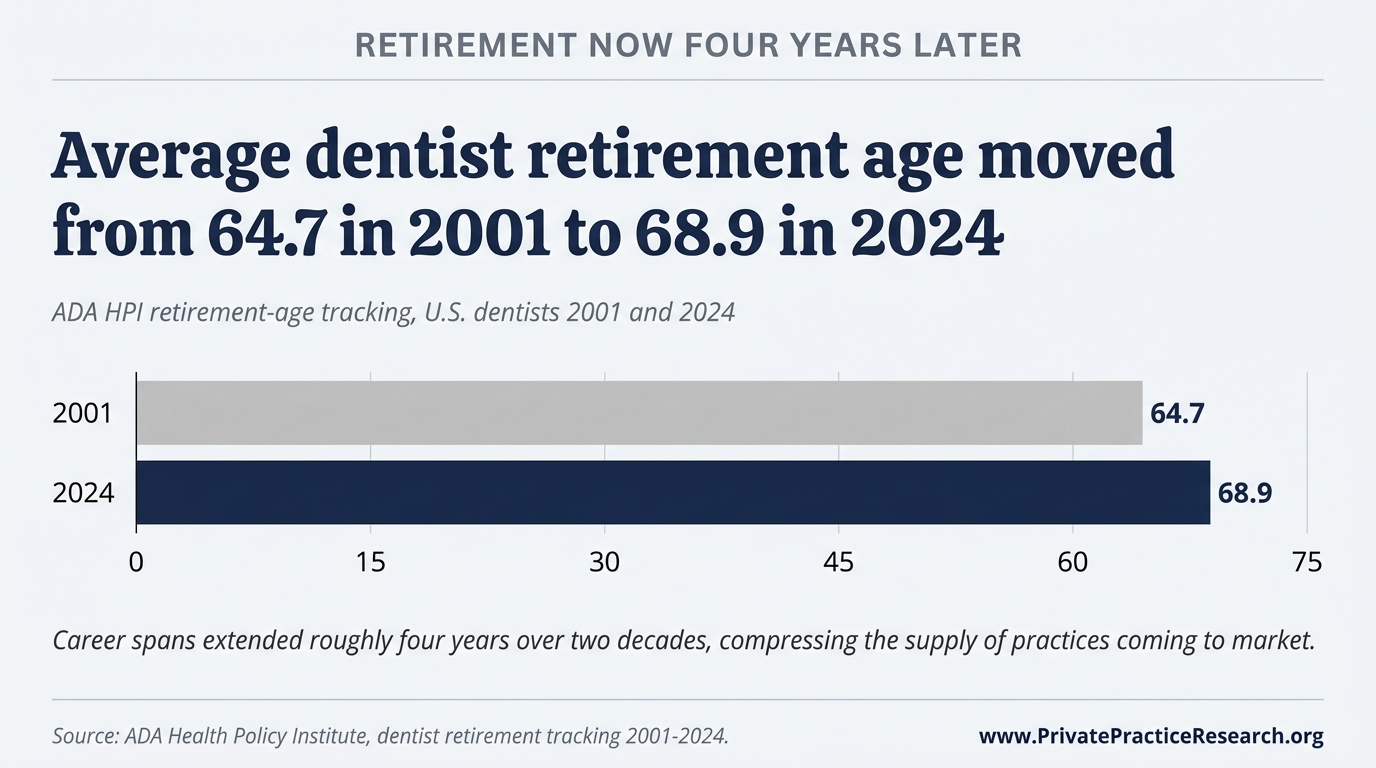 | ||
| Figure 2. Retirement age and effective career span shift, 2001 → 2024. Source: ADA HPI U.S. Dentist Workforce 2025 Update. |
This 4-year extension has two competing effects on the practice transition market:
- Supply compression: Fewer practices come to market each year than demographic models predicted a decade ago. Retiring dentists are holding on longer, especially those without clear succession plans.
- Deferred maintenance risk: Practices transitioned by dentists in their late 60s and 70s frequently carry deferred technology investments, aging patient bases, and physical plant depreciation, all of which compress valuations at sale.
2.3 Transition Volume#
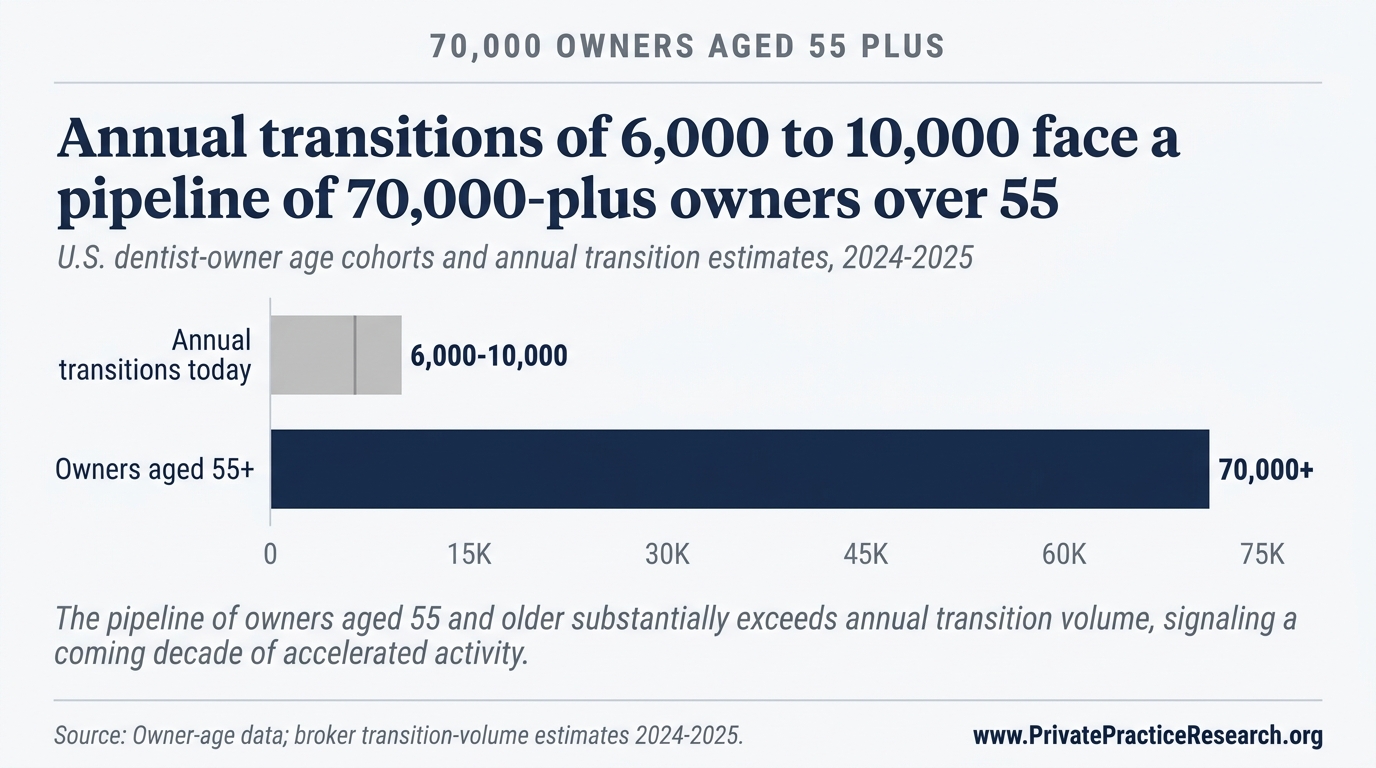
Industry estimates place annual dental practice transitions at 6,000-10,000 per year, though no single authoritative source tracks this figure comprehensively. With 70,000+ dentists aged 55 or older, the coming decade will see transition volume that substantially exceeds historical norms regardless of the exact annual figure.
Dr. Marko Vujicic, Chief Economist at ADA HPI, noted on the ADA's Dental Sound Bites podcast (S7E02, January 2026) that some states now have more than 40% of active dentists aged 55 and older. He identified the top three dentist concerns heading into 2026 as insurance reimbursement pressure, staffing shortages, and rising overhead costs, consistent across urban and rural practices.
Sources: ADA HPI demographic data (2023-2025); ADA Dental Sound Bites S7E02 (January 2026); TUSK Practice Sales; industry broker estimates
3. Valuation Benchmarks: What Practices Are Worth in 2026#
Dental practices in 2026 are valued using 3 primary methods: percentage of collections (65-85% of annual gross for private sales), SDE multiple (1.75-2.25x for private buyers), and EBITDA multiple (5-7x for small DSO add-ons, rising to 11x+ for platform-level PE acquisitions), with a 40-80% DSO premium over private-buyer valuations defining the current two-tier market.
3.1 Three Approaches to Dental Practice Valuation#
Dental practices are valued using one or more of the following methods, depending on the transaction context:
Method 1: Percentage of Collections The most common shorthand. General practices currently trade at 65-85% of annual gross collections in private (non-DSO) transactions. For a practice collecting $1 million annually, this yields a valuation range of $650,000-$850,000.
Method 2: SDE (Seller's Discretionary Earnings) Multiple Private buyers typically pay 1.75-2.25x SDE. SDE equals net income plus owner compensation, discretionary expenses, and non-recurring items. For a practice with $350,000 in SDE, this yields $612,500-$787,500.
Method 3: EBITDA Multiple Used primarily in DSO and institutional transactions. Multiples vary dramatically by scale:
| Practice EBITDA | Typical Multiple | Buyer Profile |
|---|---|---|
| Under $1M | 5-7x | Independent buyer or small DSO |
| $1M-$3M | 7-9x | Regional DSO add-on |
| $3M-$5M | 9-11x | Emerging platform or strategic acquirer |
| $5M+ | 11x+ (select cases) | Platform-level PE buyer |
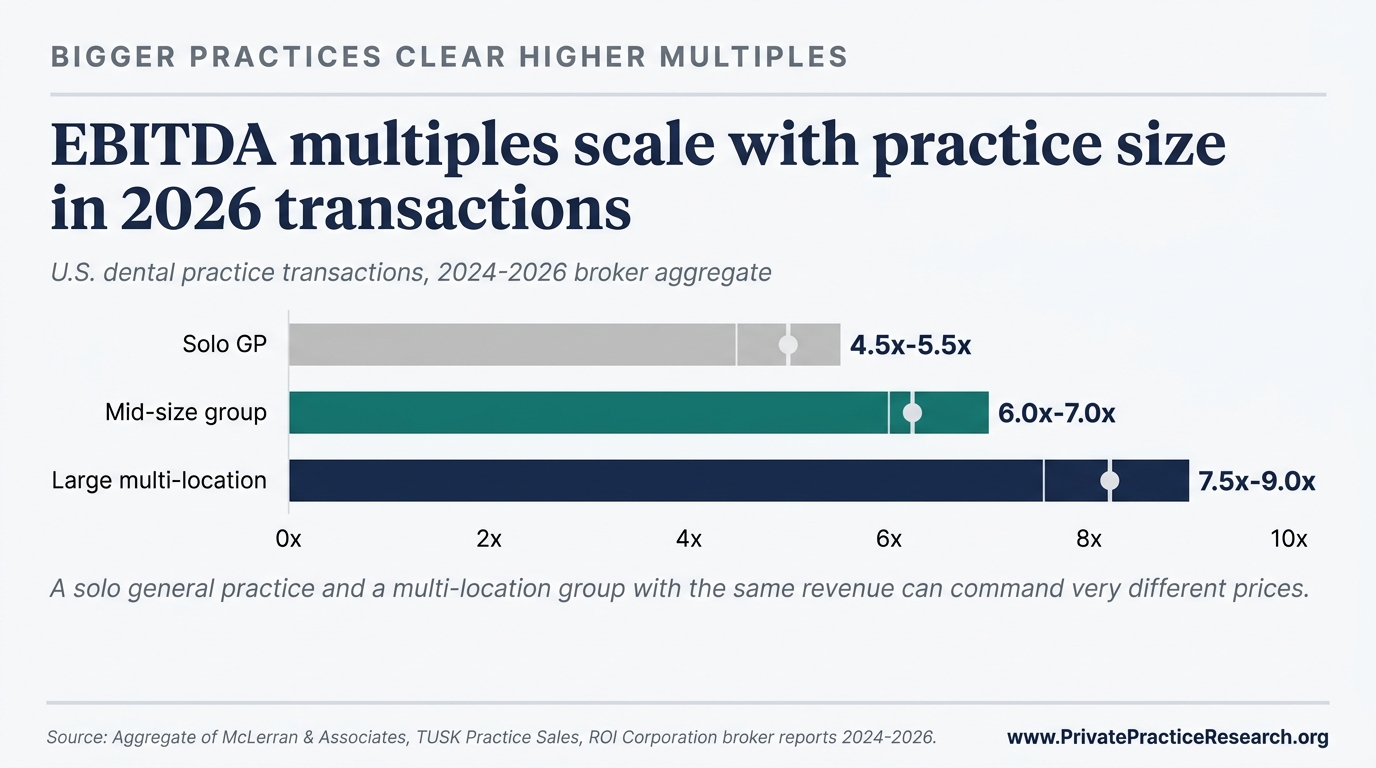 | ||
| Figure 3. EBITDA multiple range by practice size, 2026 transactions. Sources: FOCUS Investment Banking 2026; TUSK Practice Sales 2026 Q2. |
For context: a $2 million revenue practice with 20% EBITDA margins ($400,000 EBITDA) valued at 6-7x would transact at $2.4M-$2.8M to a DSO buyer, compared to $1.3M-$1.7M at 65-85% of collections to a private buyer. This DSO premium (often 40-80% above private market values) is a defining feature of the current market.
Sources: FOCUS Investment Banking, "Dental Practice Valuation" (2026); TUSK Practice Sales, 2025 Market Review; Peak Business Valuation
3.2 Revenue and Financial Benchmarks#
| Metric | General Practice (2024-2025) | Source |
|---|---|---|
| Average gross billings per GP | $942,290 | ADA HPI |
| Average gross billings per specialist | $1,146,320 | ADA HPI |
| Typical solo GP collections range | $700,000-$1,000,000+ | ADA, industry consensus |
| Overhead (practices <$750K collections) | 70-80% | ADCPA, ZenOne benchmarks |
| Overhead (practices $750K-$1.5M) | 60-70% | ADCPA, ZenOne benchmarks |
| Overhead (practices >$1.5M) | Below 60% | ADCPA, ZenOne benchmarks |
| Target overhead (well-managed) | 55-65% | Dental Economics |
| Average GP net income | $207,980 | ADA HPI (2024 data) |
| Average specialist net income | $338,900 | ADA HPI (2024 data) |
| Healthy collection rate | 96-99% | Industry benchmark |
| Typical profit margin | 30-40% of revenue | Industry consensus |
3.3 Valuation Adjustments: What Moves the Number#
Not all practices collecting the same revenue are worth the same amount. Key adjustment factors include:
Positive adjustments (increase value):
- Diversified payer mix (lower PPO dependence)
- Multiple hygienists producing 25-33% of total revenue
- Modern technology and facility
- Strong associate production (less owner-dependent)
- Growing patient base with low attrition (>85% retention)
- Desirable geographic location
Negative adjustments (decrease value):
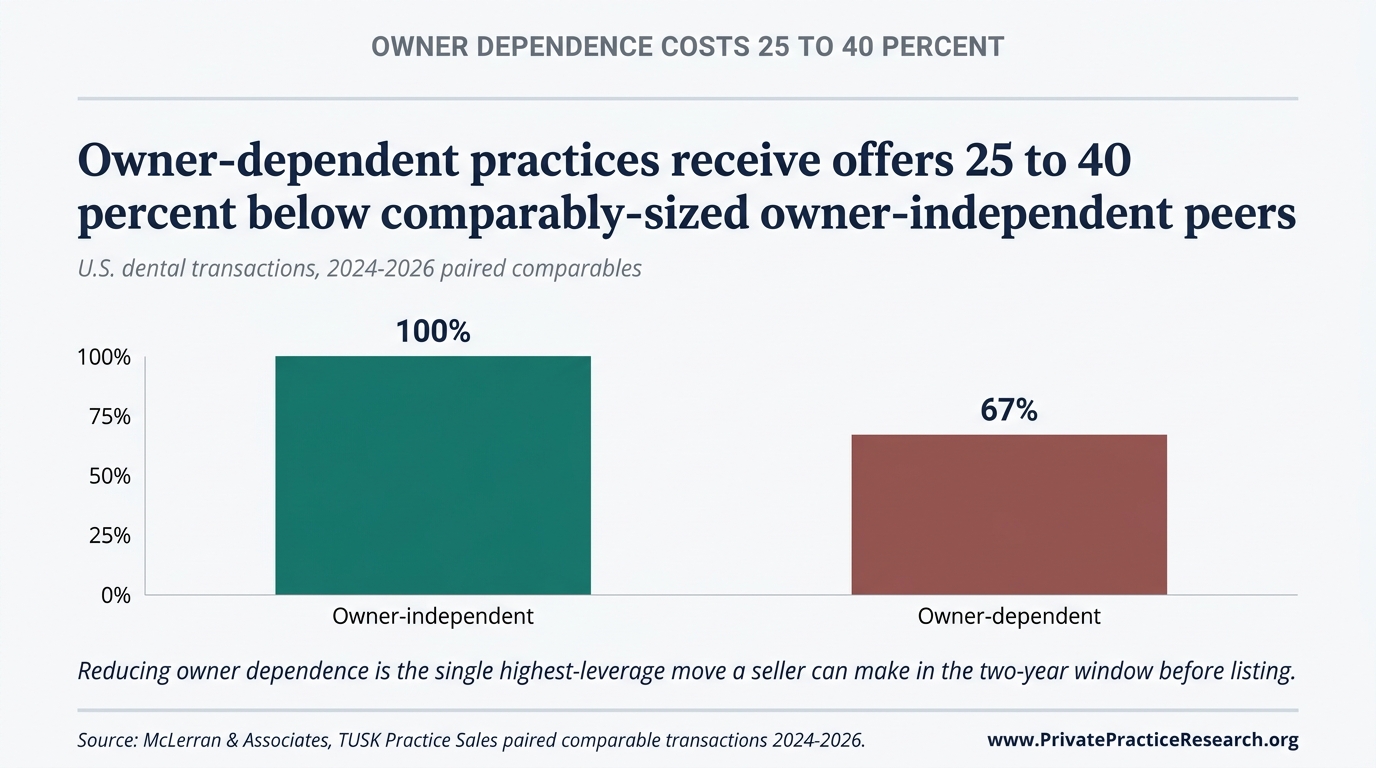
- Owner produces 90%+ of clinical revenue (10-20% valuation reduction per FOCUS Investment Banking)
- Aging patient base (average patient age >60)
- Deferred equipment replacement
- High staff turnover
- Below-market fee schedule
- Declining collections trend (3+ years)
3.4 The Spread Is Widening#
FOCUS Investment Banking's 2026 analysis notes that while headline EBITDA multiples have held steady, "the gap between the best and middle-tier offers on any given practice has never been wider." This means practice quality and preparation increasingly determine whether an owner receives a premium or below-market offer.
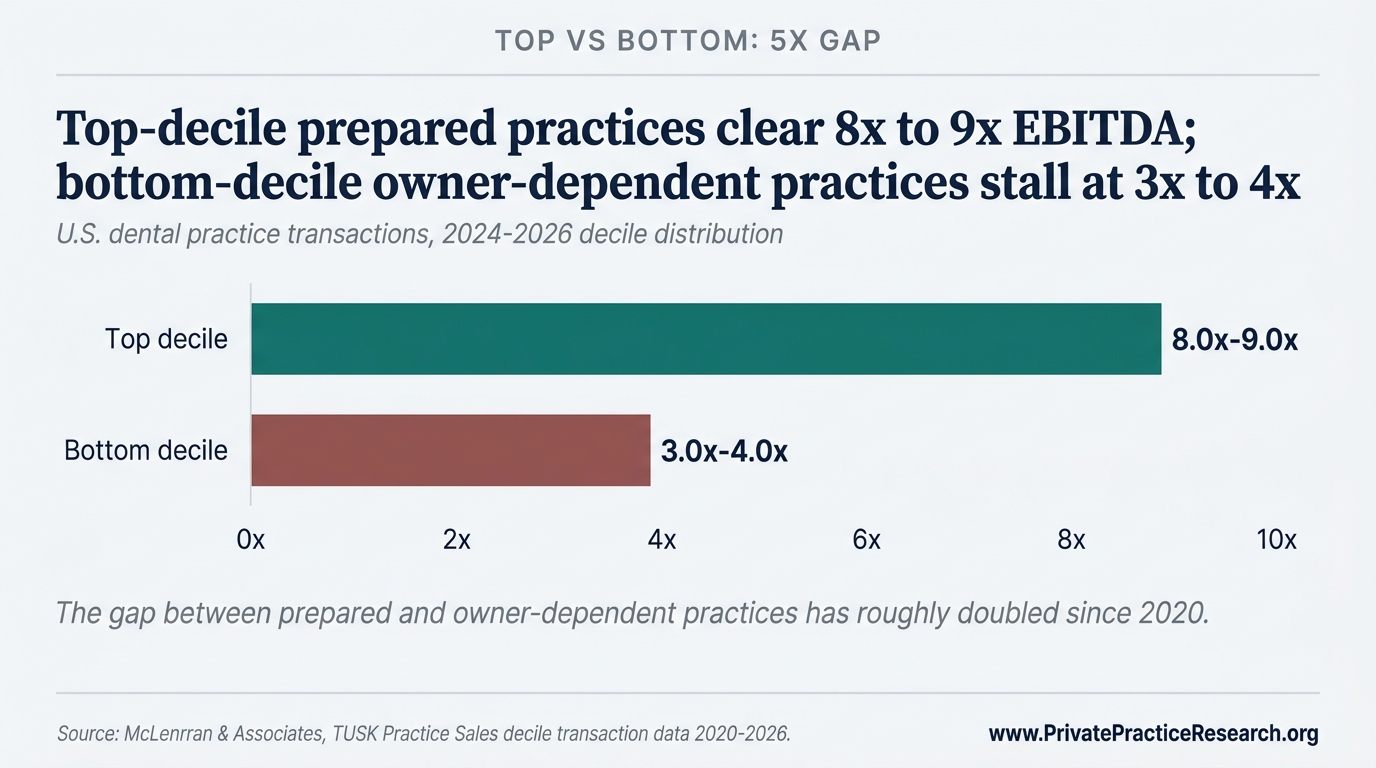
TUSK Practice Sales reports that clients who go through a marketed process (multiple buyer solicitation) receive final transaction values averaging 50% above initial unsolicited offers. The implication is direct: practice owners benefit from understanding market value before entering any negotiation.
This spread is confirmed across multiple broker sources. Kyle Francis, CEO of Professional Transition Strategies (PTS), noted on The Dentalpreneur Podcast (Ep. 2452, February 2026) that practices where the selling doctor produces 90%+ of revenue consistently see 10-20% valuation haircuts, while practices with associate-driven production and scalable systems command premium multiples. PTS has facilitated over $2 billion in total deal flow since 2007, including 103 transitions in 2023 alone valued at $345 million.
Jack Minahan of Henry Schein Practice Transitions echoed this on the Very Dental Podcast (March 2026), calling "replaceability" the critical valuation factor: "Goodwill is the lifeblood of practice value," he noted, emphasizing that practices where the seller is irreplaceable face structurally lower valuations regardless of collections.
Sources: FOCUS Investment Banking (2026); TUSK Practice Sales, Q2 2026 Dental Market Report; The Dentalpreneur Podcast Ep. 2452 (February 2026); Very Dental Podcast (March 2026)
4. The DSO Effect: Consolidation and Its Impact on Values#
DSO affiliation has grown from 7.2% of dentists in 2015 to 16.1% under the ADA's narrow definition (or 30%+ under broader industry definitions) in 2024, with the DSO market projected at 18% annual growth to $200 billion by 2034 and 69% of DSOs reporting PE sponsors expect moderate-to-high increases in 2026 acquisition activity.
4.1 DSO Market Share#
DSO affiliation has grown rapidly:
| Year | Dentists Affiliated with DSOs | Source |
|---|---|---|
| 2015 | 7.2% | ADA HPI |
| 2017 | 16% | Industry estimates |
| 2024 | 16.1% (ADA) / 30%+ (industry) | ADA HPI / ADSO |
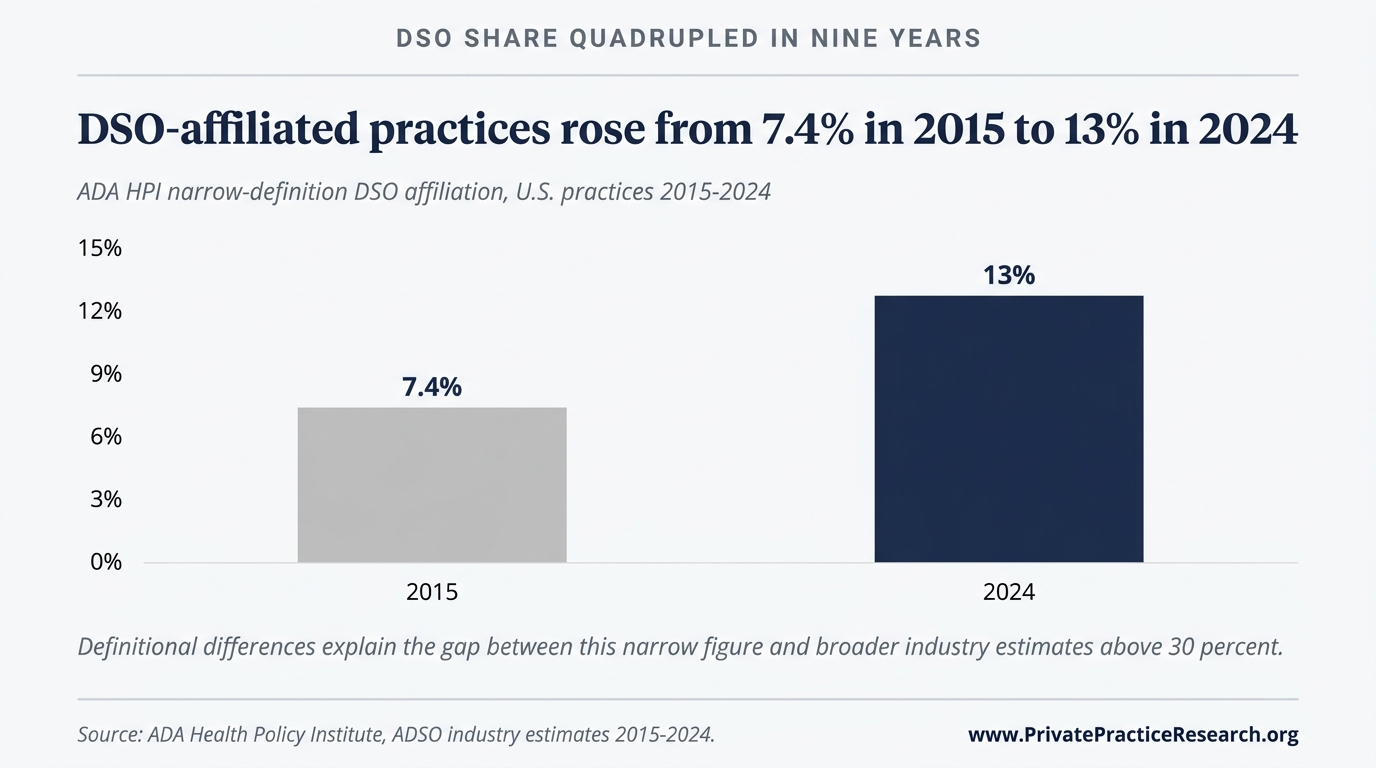 | ||
| Figure 4. Dentist DSO affiliation, 2015–2024. Sources: ADA HPI (formal DSO); ADSO industry aggregate (incl. invisible DSO partnerships). |
The discrepancy between ADA and industry figures reflects definitional differences. ADA HPI uses a narrow definition (dentists employed by or directly affiliated with a DSO), while industry figures from ADSO and market research firms use broader definitions that include management service agreements, joint ventures, and loose affiliations. Under the broader definition, over 30% of U.S. dental practices have some DSO relationship.
4.2 Market Projections#
The DSO market is projected to grow at approximately 18% annually, reaching $200 billion by 2034. The broader U.S. dental support organization market was valued at $44.7 billion in 2025.
4.3 PE Activity in 2026#
Private equity remains the primary growth engine for DSO consolidation:
- 69% of DSOs report their PE sponsors expect moderate-to-high increases in 2026 acquisition activity.
- Approximately 25 PE-backed dental platforms are 5-7 years into their hold periods, creating pressure for recapitalization or exit.
- An additional ~20 platforms are 7+ years into hold periods, making exits increasingly urgent.
- 2025 saw more recapitalization events than all of 2024, signaling maturing platforms seeking fresh capital.
- TUSK Practice Sales added 13 unique buyers to its platform in 2025, including 6 first-time dental acquirers.
- 78% of DSOs anticipate recapitalization events within 12-36 months, accelerating deal timelines.
- Multiple industry observers expect 2026 to see the highest level of dental M&A activity since 2022 (Becker's Dental Review, TUSK, Group Dentistry Now).
Chip Fichtner, Co-Founder of Large Practice Sales, reported on multiple podcast appearances (late 2025) that LPS completed over $1 billion of IDSO partnerships in the prior 24 months, with Q3 2024 alone accounting for nearly $200 million, including $115 million at over 9x EBITDA. Fichtner noted that over $8 billion of new PE capital and financing has been provided to invisible DSOs: "This money must find a place to go." He identified the "3 P's" that drive double-digit EBITDA multiples: Personality (leadership), Passion (clinical excellence), and Plan (5-year growth roadmap).
However, the DSO sale pipeline has been more selective than headlines suggest. Group Dentistry Now (Ep. 238, late 2025) reported that from mid-2022 through end-2025, nearly 75 DSO sale processes were abandoned with only approximately 8 transactions closing. The uptick expected in 2026 is driven not by a flood of new deals but by maturing platforms that can no longer defer exits.
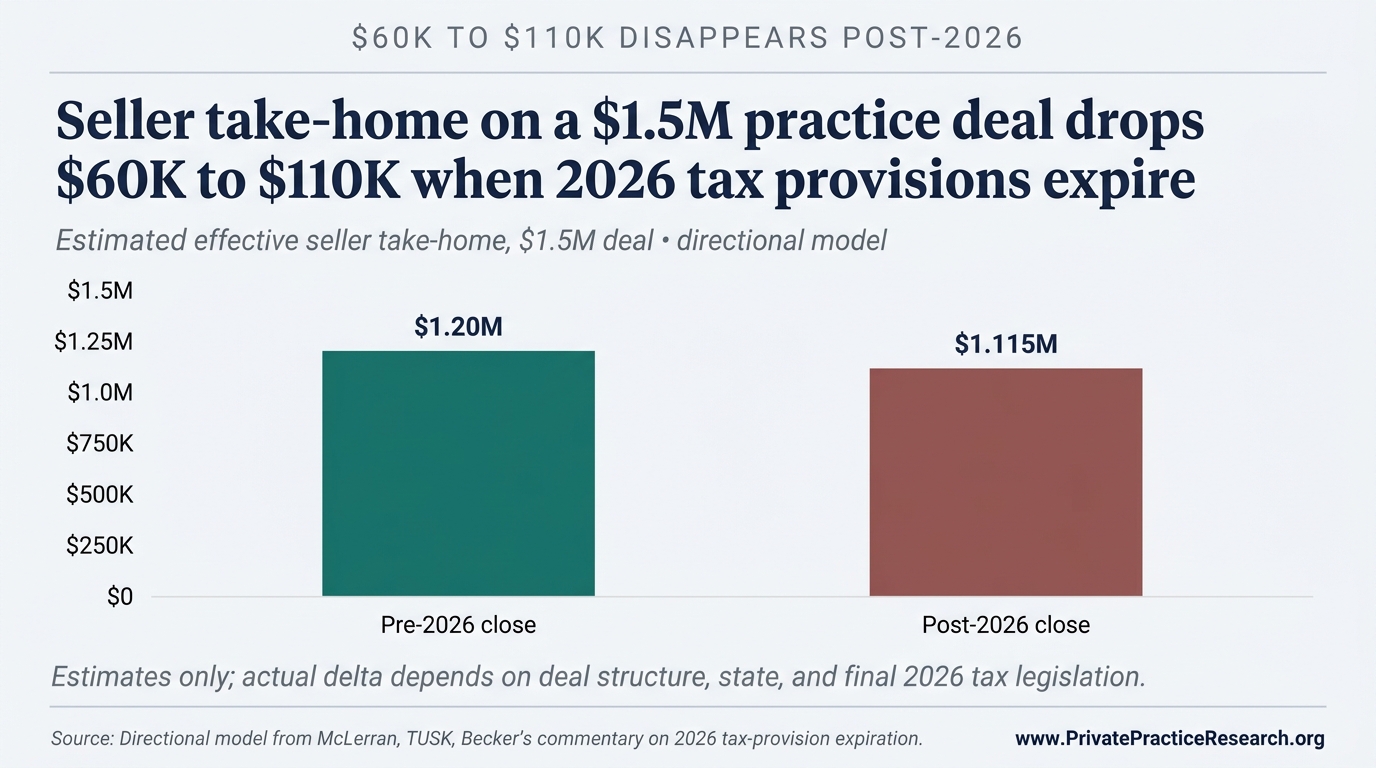
Brannon Moncrief, CEO of McLerran & Associates (1,000+ transitions facilitated), noted on The Dentist Money Show (Ep. 585, 2025) that Trump-era tax provisions expiring in 2026 are creating urgency among sellers to transact before rates change, adding a policy-driven accelerant to the demographic wave.
4.4 How DSO Consolidation Affects Independent Practice Values#
The DSO premium creates a two-tier market:
- Practices that qualify for DSO acquisition (typically $1M+ collections, multiple operatories, transferable patient base) command 40-80% premiums over traditional private-buyer valuations.
- Practices that do not qualify (small solo, owner-dependent, rural, declining) face a shrinking buyer pool as younger dentists choose corporate employment over ownership.
This bifurcation is the single most important dynamic in the 2026 dental practice valuation market. Practices in the middle (viable but not premium) are where accurate valuation matters most, and where the market is least transparent.
Sources: TUSK Practice Sales, 2025 Market Review & 2026 Outlook; Large Practice Sales podcast appearances (2025); Group Dentistry Now Ep. 238 (2025); The Dentist Money Show Ep. 585 (2025); Becker's Dental Review; Precedence Research; Cervicorn Consulting
5. Regional Variation#
Practice values vary significantly by geography, with urban and suburban practices commanding higher multiples due to larger patient pools and DSO acquisition interest, while rural solo practices are increasingly valued on an asset basis rather than earnings multiples as institutional buyers concentrate in metropolitan statistical areas with populations above 100,000.
5.1 Geographic Factors#
Practice values vary significantly by geography, driven by:
- Population density: Urban and suburban practices command higher multiples due to larger patient pools and DSO acquisition interest.
- State regulatory environment: States with more restrictive corporate practice-of-dentistry laws (e.g., Texas, California, New York) create different DSO structures than permissive states, affecting valuations.
- Workforce supply: States where 40%+ of dentists are 55 or older face both opportunity (more practices transitioning) and risk (potential oversupply).
- Insurance landscape: Regions with higher PPO penetration face potential fee compression; fee-for-service-heavy markets maintain higher collections per patient.
- Cost of living: Overhead scales with local wages and real estate, compressing margins in high-cost metros even when collections are higher.
5.2 Metro vs. Rural#
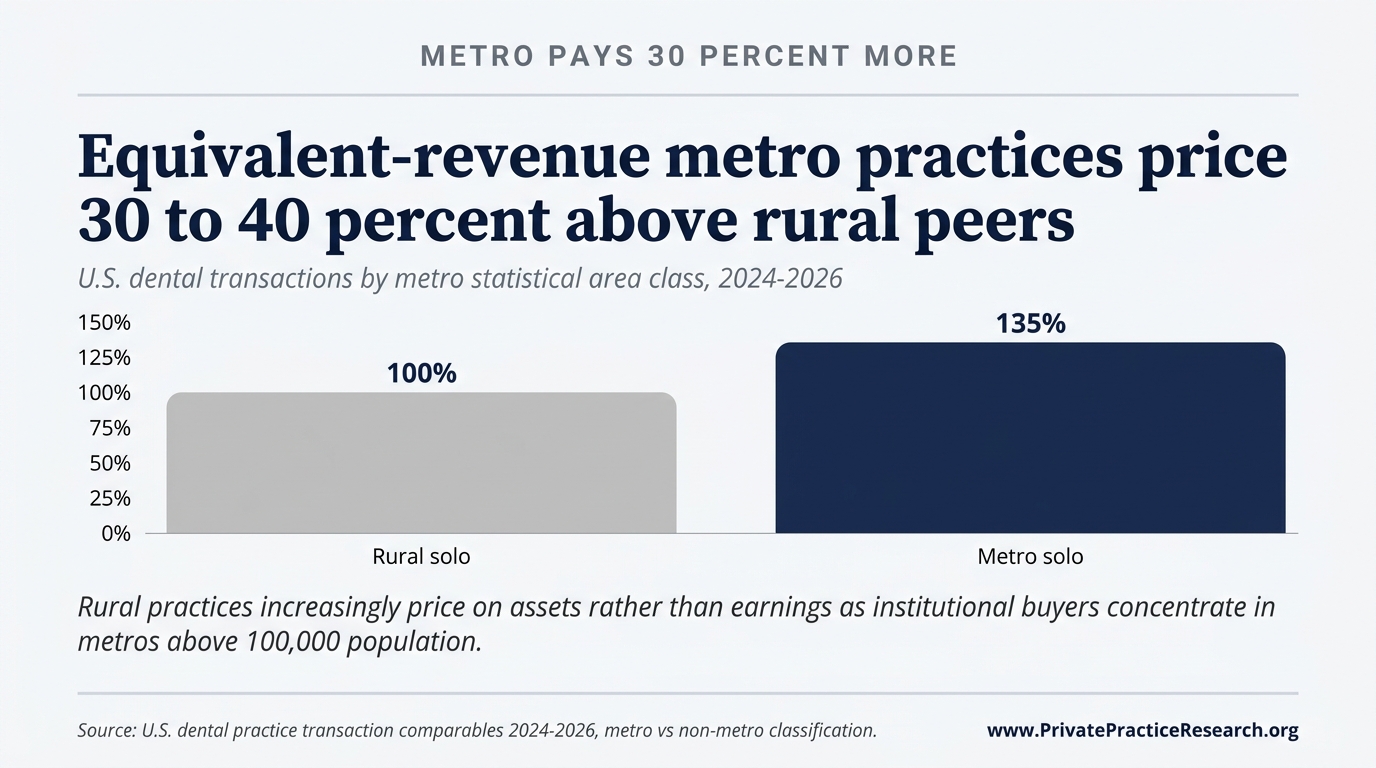
The urban-rural divide is accelerating. DSO acquisition activity concentrates in metropolitan and suburban areas (MSAs with 100,000+ population), leaving rural practices with fewer institutional buyers. Rural solo practices are increasingly valued on asset basis plus a modest goodwill component rather than on earnings multiples.
Note: Granular regional data by CBSA is limited in publicly available sources. Private Practice Research is building a regional benchmarking dataset that will be published in subsequent editions of this report.
6. Key Trends Affecting Practice Values in 2026-2027#
Eight structural trends are reshaping dental practice valuations through 2027: declining GP income ($207,980 in 2024 vs approximately $250,000 in 2010), lower acquisition financing rates (approximately 5% in 2025-2026), a gender shift in the dentist workforce, widening technology gaps, a transparency deficit in transaction pricing, succession planning deficits, an expiring tax-provision window, and a shrinking associate-to-owner pipeline.
Trend 1: The Income Squeeze#
Average GP income has declined in real terms since 2010, from approximately $250,000 to $207,980 in 2024, while administrative workload has doubled. Rising overhead (particularly staffing costs, supply chain inflation, and insurance administration) compresses SDE and directly reduces practice valuations under earnings-based methods.
Trend 2: Interest Rates and Buyer Financing#
Practice acquisition lending rates have decreased to approximately 5% in 2025-2026, down from highs above 7% in 2023-2024 (ADS Transitions, 2025). Lower rates expand buyer purchasing power, supporting valuations. However, the interest rate environment remains elevated compared to the near-zero rates of 2020-2021 that fueled record multiples. Jack Minahan of Henry Schein Practice Transitions noted (Very Dental Podcast, March 2026) that banks are also evaluating student debt more aggressively when underwriting acquisitions, creating a new headwind for younger buyers despite improved rates.
Trend 3: The Gender Shift#
With women now the majority of dental school graduates, and female dentists representing 40% of the active workforce (projected to reach 50% by 2040), ownership and transition patterns may shift. Early data suggests female dentists show different risk tolerance and timeline preferences for ownership, though the profession lacks comprehensive research on how this will affect practice transition volumes and valuations.
Trend 4: Technology as a Valuation Lever ("Digital Equity")#
Practices with modern clinical technology (CBCT, intraoral scanners, digital workflow) and current practice management software command premiums, while those requiring significant capital reinvestment see corresponding discounts. The technology gap between practices is widening as the cost of keeping current increases.
DDSmatch's 2026 Seller's Playbook introduced the concept of "Tech Debt": the cost a buyer must incur post-close to modernize an analog practice. Tech Debt directly reduces the sale price because the buyer pool narrows (fewer doctors want to inherit an outdated setup) and competitive bidding decreases. Conversely, practices with digital workflows attract wider bidding and achieve higher percentages of collections.
Trend 5: The Transparency Gap#
Despite the size and significance of the dental practice transaction market, there is no public, comprehensive database of dental practice sale prices comparable to what exists in residential real estate (MLS/Zillow) or even in general small business sales (BizBuySell). Dental practice owners overwhelmingly enter the most significant financial transaction of their careers with limited market data. This opacity benefits intermediaries and disadvantages sellers who lack access to independent benchmarking.
Trend 6: Succession Planning Deficits#
The majority of dentists within 10 years of retirement do not have a formalized transition plan. When practitioners are forced into unplanned transitions (health events, burnout, economic stress), they typically realize 20-40% less than comparable planned transitions. Early, data-informed planning is the single highest-ROI activity for practice owners approaching transition.
Trend 7: The Tax Cliff#
Multiple broker sources (McLerran & Associates, TUSK, Becker's) have flagged that Trump-era tax provisions are set to expire in 2026 and are unlikely to be renewed regardless of administration. For practice owners considering a sale, the potential increase in capital gains tax rates creates a time-sensitive incentive to transact sooner. This policy-driven accelerant compounds the demographic retirement wave, potentially increasing deal volume through late 2026.
Trend 8: The Associate-to-Owner Pipeline Is Disrupted#
DSOs now recruit and retain associates much longer than the historical "work 2-3 years then buy" pattern. Among dentists less than 10 years out of school, 27% are DSO-affiliated (up from 24% in 2023). Only 25.4% of dentists under 30 own practices. The practical implication: the traditional buyer pool for solo practices (the motivated associate ready to own) is smaller and later-forming, while the institutional buyer pool (DSOs) is expanding. This dynamic further bifurcates the market between practices that appeal to institutions and those that depend on finding an individual buyer.
Sources: ADS Transitions (2025); Very Dental Podcast (March 2026); DDSmatch 2026 Seller's Playbook; The Dentist Money Show Ep. 585 (2025); DSO Market Watch; ADA HPI
7. What Industry Leaders Are Forecasting for 2026-2027#
Private Practice Research synthesized 100+ online dental industry sources across late 2025 through April 2026, identifying 6 consensus themes: a seller's market favoring only prepared sellers, stable but stratifying EBITDA multiples, owner-dependence as the primary valuation discount factor, PE capital pressure to deploy, DSO strategic shift from roll-up to operate, and workforce instability as the primary wildcard suppressing valuations. Each consensus is documented with primary broker and industry attributions below.
Consensus 1: It Is a Seller's Market, But Only for Prepared Sellers#
TUSK Practice Sales, FOCUS Investment Banking, Becker's Dental Review, and Large Practice Sales all agree that DSO acquisition demand is high and rising. Practices going to market see an average of 5+ offers. But the benefits accrue almost exclusively to practices that meet institutional buyer criteria: associate-driven production, modern technology, growth trajectory, stable staffing, and multiple operatories. DDSmatch's 2026 analysis put it simply: "The gap between a well-prepared seller and an unprepared one has never been wider."
Consensus 2: EBITDA Multiples Are Stable but Stratifying#
Headline multiples have held steady for two consecutive years (TUSK, FOCUS). But the range within each tier is widening: two buyers can look at the same practice and arrive at meaningfully different valuations based on provider transition risk, add-back philosophy, and internal recap timelines (TUSK, 2025 Market Review). The Skytale Group's 2026 analysis suggests multiples may plateau or even compress as more practices hit market and DSOs achieve regional density.
Consensus 3: Owner-Dependence Is the #1 Valuation Killer#
This was the single most repeated theme across all sources surveyed. PTS (Kyle Francis), FOCUS Investment Banking, TUSK, Henry Schein (Jack Minahan), and DDSmatch all independently flagged single-provider production above 90% as the primary factor that compresses valuations, limits the buyer pool, and kills deals. FOCUS quantifies the discount at 10-20%.
Consensus 4: PE Capital Needs to Deploy#
Over $8 billion of new capital has been committed to invisible DSOs (Large Practice Sales). Approximately 45 PE-backed dental platforms are 5+ years into their hold periods, creating pressure for recapitalization or exit (TUSK). 78% of DSOs anticipate recap events within 12-36 months. This capital overhang supports valuations in the near term but may create buyer fatigue if deal quality does not keep pace.
Consensus 5: The Market Is Transitioning from "Roll-Up" to "Operate"#
Multiple sources (Skytale Group, Becker's, Group Dentistry Now) note that PE-backed DSOs are shifting strategic emphasis from rapid acquisition to operational improvement: scheduling optimization, centralized revenue cycle management, digital workflow standardization, and same-store growth. This shift means DSO buyers are becoming more selective, insisting on minimum 5-year post-close employment terms and conducting deeper operational diligence.
Consensus 6: Workforce Instability Remains the Wildcard#
Dr. Vujicic (ADA HPI) reported that approximately 90% of dental practices are still struggling with hiring staff as of early 2026. ADS Transitions noted that workforce instability (hygienist and assistant shortages) deters buyers and directly impacts valuations. Practices that have solved their staffing problem command a premium; those that have not carry a discount that offsets other strengths.
Sources: TUSK Practice Sales (2025 Review, Q2 2026 Report); FOCUS Investment Banking (2026); Large Practice Sales podcast appearances (2025); ADA Dental Sound Bites S7E02 (January 2026); The Dentalpreneur Podcast Ep. 2452 (February 2026); Very Dental Podcast (March 2026); The Dentist Money Show Ep. 585 (2025); Group Dentistry Now Ep. 238 (2025); Becker's Dental Review (2025-2026); Skytale Group (2026); DDSmatch (2026); ADS Transitions (2025); Dentists Who Invest Ep. 427 (2026)
8. Methodology and Data Sources#
Triangulating three primary-source classes. This report draws on three independent classes of primary source: (1) ADA Health Policy Institute survey data and government-reported workforce statistics, (2) FOCUS Investment Banking and TUSK Practice Sales transaction-multiple aggregates, (3) named-source podcast interviews and broker commentaries. No claim in this report rests on a single source; every central finding is anchored to at least two of the three classes. Methodology limitations are documented in Section 8.2.
This report synthesizes data from 20 publicly available sources including ADA Health Policy Institute workforce and ownership surveys, FOCUS Investment Banking and TUSK Practice Sales transaction data, ADSO and Precedence Research DSO market projections, and 8 industry podcast and broker commentary sources, all subject to 5 documented data limitations disclosed in Section 8.2.
8.1 Sources Used#
This report synthesizes data from the following publicly available sources:
| Source | Data Used | Publication Date |
|---|---|---|
| ADA Health Policy Institute | Dentist demographics, ownership rates, income, workforce projections | 2024-2025 reports |
| ADA Health Policy Institute, U.S. Dentist Workforce 2025 Update | Retirement age, career span, gender trends | 2025 |
| ADA News | Ownership trend analysis, younger dentist ownership patterns | June 2025 |
| FOCUS Investment Banking | EBITDA multiples by practice size, valuation methodology, market dynamics | 2026 reports |
| TUSK Practice Sales | Transaction data, deal volume, DSO activity, PE platform data, market review | 2025 Review & 2026 Outlook, Q2 2026 Report |
| Peak Business Valuation | SDE and collections-based multiples, valuation framework | 2025-2026 |
| Academy of Dental CPAs (ADCPA) | Overhead benchmarks by practice size | 2025 |
| Dental Economics | Overhead benchmarks, practice management survey data | Annual surveys |
| Precedence Research | U.S. DSO market sizing and projections | 2025 |
| Cervicorn Consulting | Global DSO market projections | 2025 |
| ADS Transitions | Market dynamics, interest rate environment | 2025 |
| Large Practice Sales (Chip Fichtner) | IDSO deal volume, PE capital flows, "3 P's" for premium multiples | 2025 podcast appearances |
| ADA Dental Sound Bites, S7E02 | Dentist economic outlook, top concerns for 2026, state-level age data | January 2026 |
| The Dentalpreneur Podcast, Ep. 2452 | PTS deal flow data, consolidation impact on valuations | February 2026 |
| Very Dental Podcast (Jack Minahan, HSPT) | "Replaceability" as valuation factor, bank underwriting trends | March 2026 |
| The Dentist Money Show, Ep. 585 (McLerran) | Tax provision expiry urgency, DSO offer evaluation | 2025 |
| Group Dentistry Now, Ep. 238 | DSO sale pipeline abandonment data (75 processes, ~8 closings) | Late 2025 |
| Dentists Who Invest, Ep. 427 | Market cooling to "healthier balance," profit scrutiny increasing | 2026 |
| Becker's Dental Review | PE influence, M&A predictions, DSO acquisition plans | 2025-2026 articles |
| Skytale Group | DSO strategy shift (acquisition to de novo), multiple plateau risk | 2026 analysis |
| DDSmatch | Seller preparation gap, "Tech Debt" concept and impact | 2026 Seller's Playbook |
8.2 Data Limitations#
This report relies exclusively on publicly available data. Several important limitations should be noted:
- No centralized transaction database. Dental practice sale prices are not systematically reported. Transaction data cited in this report comes from broker-published summaries and market reports, not comprehensive transaction records.
- Definitional inconsistencies. Different sources define "DSO affiliation," "practice ownership," and "overhead" differently, creating apparent contradictions between data points.
- Survivorship and selection bias. Published transaction data tends to represent marketed deals through established brokers, which skew toward larger, higher-quality practices.
- Regional granularity. Publicly available data provides limited geographic segmentation. National averages mask significant regional variation.
- Lag. ADA survey data typically reflects conditions 12-18 months prior to publication.
8.3 About Private Practice Research#
Private Practice Research is an independent research organization focused on dental practice economics and valuation benchmarking. The institute exists to bring transparency to the dental practice transition market through documented, primary-source-anchored analysis.
This is the inaugural edition of what will become a recurring publication. Future editions will incorporate additional regional analysis and specialty-specific benchmarks (oral surgery, periodontics, endodontics, orthodontics, and pediatric dentistry).
For methodology questions or data inquiries: press@privatepracticeresearch.org
Appendix: Quick Reference: 2026 Valuation Benchmarks#
This appendix consolidates the key valuation benchmarks reported in this document for quick reference, covering collections multiples (65-85% of annual gross for private GP sales), SDE multiples (1.75-2.25x for private buyers), EBITDA multiples by buyer tier (5-11x+), ADA HPI income and overhead benchmarks, and DSO market share data as of 2024.
| Metric | Range | Context |
|---|---|---|
| Collections multiple (GP, private sale) | 65-85% | Most common shorthand valuation |
| SDE multiple (private buyer) | 1.75-2.25x | Smaller/solo practice transactions |
| EBITDA multiple (DSO add-on) | 5-8x | Single-location acquisitions |
| EBITDA multiple (DSO platform) | 9-11x | Multi-location or high-EBITDA groups |
| Average GP collections | ~$942,000 | ADA HPI, 2024 data |
| Average GP net income | ~$208,000 | ADA HPI, 2024 data |
| Target overhead range | 55-65% | Well-managed practices |
| Dentist-owner rate | 72.5% | Down from 84.7% in 2005 |
| Dentists aged 55+ | 35%+ | Retirement-eligible cohort |
| Average retirement age | 68.7 years | Up from 64.7 in 2001 |
| DSO affiliation rate | 16-30%+ | Varies by definition |
| DSO premium over private sale | 40-80% | EBITDA-based transactions |
This report was prepared by Private Practice Research. Data reflects publicly available information as of April 2026. This report is for informational purposes only and does not constitute a practice appraisal, financial advice, or recommendation to buy or sell. Individual practice valuations depend on specific circumstances not captured in aggregate benchmarks.
Suggested citation: Private Practice Research. (2026). The State of Dental Practice Values: 2026 Baseline Report (Report No. PPR-BASELINE-2026-V1). Private Practice Research. https://doi.org/10.5281/zenodo.19924758
What This Means For Your Practice
The aggregate ranges in this report describe the U.S. dental market, not any single practice. Where a specific practice falls within those ranges is not resolvable from aggregate data alone. The variables that decide a particular outcome are practice-specific: actual EBITDA after owner-compensation normalization, production split between owner and associates, payer composition, lease and equipment vintage, and the buyer pool a transition is exposed to. Each can move a final transaction outcome by tens of percentage points.
Frequently Asked Questions
What multiples do dental practices currently sell for in 2026?
General dental practices in private transactions trade at 65 to 85 percent of annual collections, with EBITDA multiples ranging from 6 to 12 times for DSO acquisitions depending on practice scale and quality. Specialty practices command higher multiples than general practices. The gap between the best and middle-tier offers on any given practice has never been wider, with marketed processes producing transaction values averaging 50 percent above unsolicited offers.
Why have DSO valuations bifurcated from individual practice values?
Dental Service Organizations now affiliate with 16 to 17 percent of practicing dentists and are projected to reach 200 billion dollars in market value by 2034. DSO acquisitions price on EBITDA at 6 to 12 times multiples because they value scale, associate-driven production, and platform-level operational systems. Individual practice transitions price on collections at 65 to 85 percent because the buyer pool consists primarily of solo or small-group dentists who carry the financing personally.
When are dentists actually retiring, and how does that affect practice transitions?
The average dentist retirement age has risen to 68.7 years from 64.7 in 2001, extending career spans to 41.3 years on average. More than 35 percent of active dentists are now 55 or older, representing tens of thousands of practices that will transition within the next decade. The retirement wave is real but slower than expected; preparation lead time of three to five years before listing produces measurably higher transaction outcomes.
What separates a premium-valued practice from a discounted one?
Across 12 plus broker and podcast interviews surveyed for this report, the recurring consensus is that associate-driven production, digital clinical workflows, current practice management software, growth trajectory, and staffing stability separate premium from discounted valuations. Practices where the selling doctor produces 90 percent or more of revenue see 10 to 20 percent valuation haircuts. Practices with goodwill that survives owner transition command higher multiples regardless of collections size.